13 July 2007

Learning at the Smorgasbord – AAMT 2007


Professional conferences have always been a convenient way for me to learn. I am away from the distractions of the home and work environment and I have a magnificent choice of topics from the many sessions offered by colleagues and other knowledgeable people.

The 21st biennial conference of the Australian Association of Mathematics Teachers was held in Hobart at the beginning of July. The theme was “Mathematics: Essential for learning, essential for life” and many sessions discussed the interlinking of mathematical topics with each other and with the real world.

Unfortunately my end-of-semester exhaustion combined with a winter virus to provide a bad head cold and I spent the second day in my hotel bed trying to recover my health. I probably missed half the available session times and am still trawling through the proceedings to find some more gems.

During my time in the information technology industry, I adopted a gem-prospecting attitude to conferences and training in general. If I discovered one new, useful idea and also rediscovered one other great piece of knowledge that I had forgotten about, I felt I had “got my money's worth” from any half day training course.

On this measure of success, I am satisfied with my conference experience. I will mention just a few of the gems I have identified so far.

  • Michael Cavanagh from Macquarie University presented his investigation of “Year 7 students' understanding of area measurement” that served to remind me how often we do not appreciate the understanding (and misunderstanding) that is happening in students' minds as we teach.
  • Ken Smith from St Joseph's College, Toowoomba demonstrated how an enthusiast can take today's technology of podcasting, digital video production and interactive web-based tutorials to create effective resources to support the “digital natives” in his classroom.
  • Merrilyn Goos from the University of Queensland talked about the value in teaching across strands, across topics and across subject areas. Reminding me of the Barbie doll physical dimensions activity, Merrilyn highlighted the opportunities in starting with a big question or a big issue.
  • Susie Groves from Deakin University spoke of her personal experience with Hanna Neumann and encouraged us to put more stories into our lessons.
  • Steve Thornton and Noemi Reynolds exposed the meta-narratives hidden in our work and suggested ways to allow students to have ownership of and power over their own mathematics.
After the conference I spent a wonderful couple of days visiting friends and experiencing the beauty of south east Tasmania. I am gradually recharging for the second semester.

24 March 2007

Spaghetti Statistics

Getting Year 9 students engaged in Mathematics can be a challenge!

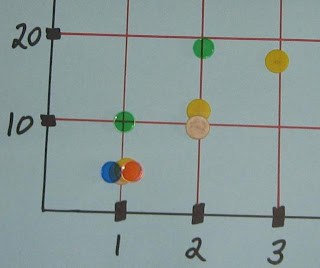
This year the first unit was statistics and we began the year with an experiment involving spaghetti and half-inch nuts. (Thanks to Matt Skoss and the AAMT mailing list. See below.)

The class was broken into groups and each team was given spaghetti, nuts and a set of counters in their own colour.

The instructions were:

Make a gap of 15 cm between two desks. Stretch a piece of spaghetti across the gap, and hang a plastic cup underneath using two large paperclips. Add half-inch nuts into the cup until the spaghetti breaks.

Place a coloured counter on the cardboard graph at the front of the room to represent the number of nuts needed to break the spaghetti. Repeat the process with 2, 3 and 4 pieces of spaghetti.

To add interest, some students were still and video photographers for the event and the results were shown on the interactive whiteboard in the following lesson.

The one-minute video is on YouTube.

The data was analysed by each group and then as a class collection with the opportunity to discuss possible reasons for data variability, measures of central tendency, spreadsheet analysis of data and graphical representation of statistics.

The students seemed to enjoy it and the activity was a positive start with a new group. The use of the interactive whiteboard has been a real bonus this year but more about that later.

aamt-l is fantastic. The mailing list of the Australian Association of Mathematics Teachers allows sharing of ideas and questions on any aspect of teaching Maths.

As Ray Peck says,
The AAMT list is a brilliant resource for Australian teachers - it enables teachers young and old to tap into a wealth of knowledge and experience and receive instantaneous feedback - not just from within all Australian states but also from member teachers from other countries. The depth and breadth of knowledge of those 'lurking on the list' is incredible.

At the end of January, Elizabeth Stone, put a challenge to the list. She wanted to start the term with a bang and was looking for ideas. A number of great suggestions came from list members and I particular liked the spaghetti experiment from Matt Skoss. He said it had been shared at a TI Cubed Conference. As he explained,
I have found lots of kids willing to make conjectures, displaying a wide range of mathematical skills. There is scope to bring in graphical calculators and spreadsheets to do some mathematical modelling. Lots of scope for statistics and ongoing discussion.

Thanks to Matt and Elizabeth and the AAMT list for helping me start the term with a bang!

Time Bandits

“There's no time,” I wrote when considering the threats to maintaining a regular blog.

“Time will tell,” I said in the tabloid sign-off.

It has only been a couple of months but already my writing output has evaporated. The time bandits include the predicted and the predictable - lesson preparation, marking tests, walking the dog – just living and working.

Then there are the things that steal my energy rather than my time – performing in front of classes, managing difficult student behaviour, working in hot classrooms on the top floor of a school without air-conditioning.

Waiting to take advantage of the lack of time and energy are the lurking enemies – procrastination and demotivation.

But now, having reread the positive reasons for starting this, I will resume the process of reflecting on my teaching and sharing my experience.

02 February 2007

Teaching is like Healthcare


Before becoming a teacher, I worked in the health sector.

Actually, I worked in the information technology industry that supported the health sector. I had customers who were individual doctors, pharmacists, physiotherapists. I had customers who were medical centres, hospitals, pharmaceutical companies, professional organisations, insurance companies and government departments.

I don't pretend to be an expert on the healthcare industry but I did have a small window into how things worked and how people thought about their roles.

There are similarities between health and education. Health sector people hated you saying that health was like anything else. They were proud of being different (and important and complex).

I suspect that education people also have a sense of working in a sector that is different (and important and complex). But I have been a high school teacher for only three years and worked in only one school so I don't have a lot of data to work on.

In healthcare, it is hard to measure whether you are successful. Of course you can count how many of your patients died, but that is a very basic indicator. Even when using basic mortality statistics, there is debate about how to categorise the cause of death, particularly if there were multiple diseases.

At the individual level, I might be the specialist physician treating you for heart disease and you die from cancer. Is that a win or a loss on my personal measure of success?

Keeping people alive is one objective and there is debate about whether it is an overriding objective. Other stated aims of healthcare are curing illness, improving wellbeing and preventing diseases.

Measures of morbidity are much more difficult than measures of mortality. How well do you have to be before I declare you cured? Did I improve your health? How do I measure your level of wellbeing? How do I know whether my interventions made the difference? How sick were you before I started treating you?

Measuring success in healthcare is very difficult and very expensive. Most effort has gone into evaluating pharmaceutical products because that is where the money is. Even in this field, incorrect conclusions have been made and drugs have been withdrawn from the market.

Measuring success in teaching is even harder. What is the purpose of education? Do we want our students to be knowledgeable people or productive members of society or well-rounded individuals or happy?

Even if we can agree on the objective, how can we measure success? Perhaps I could count the number of my students who ended up in prison or who became millionaires. But how much did I influence the result? There were other teachers in my students' lives not to mention their parents, friends, coaches and society in general.

I turned my mind to this comparison of teaching and healthcare after coming across an older posting by TMAO "On Caring".

Educational leaders are selling the need to care more because it's all they got. There isn't anything else they can do. Because teaching is bereft of meaningful evaluatory tools, professional standards of competence, and anything approaching a system of accountability, the only way to bring about better results is by growing the level of caring. ... Caring is the mechanism that has replaced the formal requirements of competence that exist in nearly every profession, from law to roofing.

I have to agree with TMAO that the education business has come to rely on caring as a heart-warming theme. It motivates and sustains the team of workers that struggle for positive results in difficult working conditions. But this situation is not unique. Other activities in society have the same difficulty in measuring success and maintaining morale and healthcare is one.

An anonymous comment on the post on caring, made the healthcare link.

The tension between idealistic caring on the one hand and professionalism on the other may be similar for teachers as for nurses. ... For teaching as for nursing, emphasizing the idealistic aspects of the job quite likely contribute to selecting somewhat more for individuals who need to be needed and less for candidates who are highly ambitious and mastery-oriented.

Hopefully those of us who choose to teach are aiming for “mastery” in our teaching skills while building on a base of caring. But it's a tough gig. Like other “caring professions” we struggle with unclear objectives and very difficult measures of success.

Photo by Paul Schultz

25 January 2007

Mandatory blog post on blogging

Everyone does it – write in our blog about why we are blogging.

I promise not to do it too often but I feel that I need to explain why I have recently joined this community of teachers who blog. This is mostly a post for myself – to clarify my reasons for committing regular time to this activity when I could be preparing lessons, marking maths tests, maintaining relationships with family and friends or walking the dog.

As a visual person, I created a basic mind map using FreeMind and went through a SWOT analysis to crystallise my thoughts.

Of course, the strengths section is most important. After three years in the teaching profession, I realised that blogging was an opportunity for me to reflect on my work in the classroom and to clarify my thoughts. As my friend the scientist explained over coffee last week, writing things down can be a great motivator for thinking through an issue and coming to a conclusion.

Documenting discoveries also seems important to me now. How many great insights or useful resources have I encountered over the last three years, only to be forgotten or untraceable when I needed them? I see this blog as a place I can store these ideas and resources in a form I can use them later.

There is a chance that others will find the ideas useful, so sharing my experience in a public place presents the opportunity to assist others, get feedback and make links to others in similar situations.

My hopes are tempered by the fears of going public. Do I have enough worth saying? Can I find the time to put my ideas out there? Vicki Davis quotes the statistic that 55% of bloggers are still posting regularly after three months. That is a big drop-out rate and I recognise the risk.

My fear that “no-one is listening” has been easily dispelled after a couple of posts. A few supportive or appreciative comments is enough to encourage persistence.

None of this is new. Many people have expressed these ideas in different ways. I was pleased to read John Pearce's page on Why teachers blog. The response from HappyHippy at I should be marking provided me with the right words to describe my hopes and plans:
Introspective Reflection – A chance to put my own thoughts in order
Decision Making – An opportunity to argue with myself in the hope of reaching a conclusion.
Professional Journal – A method of documenting my changing opinions.


So, in the end, it is mostly about me – reflecting, clarifying, documenting – with the hope that some of my experience and insights will be of use to others.

Time will tell.

20 January 2007

Digital Images in the Mathematics Class


Using digital images as the subject of mathematical analysis can bring interest and focus to high school students.

Last October, I attended many valuable sessions at the Australian Computers in Education Conference, ACEC 2006.

One of my favourites was Jim Lowe's workshop on “Using digital images in the Maths and Science classroom”. Jim is the Project Director at the Centre for Excellence in Maths, Science & Technology located at Redcliffe State High School in the northern suburbs of Brisbane, Queensland.

Here is the abstract for his ACEC presentation:
Digital images (both still and video) provide a way of bringing the real world into the maths and science classroom. A range of freely available resources enable valuable data to be extracted from digital media to be analysed in the maths and science classroom. This session is focussed on high school curriculum. Still images provide a wealth of material for maths classes in years 8-10 and beyond while video clips provide data for both maths and physics students to analyse real life motion.

During the workshop, Jim demonstrated many ways that digital images could be used as an introduction or as the basis of a mathematical investigation. Many of the resources we tried are available or described on the resources page of the RITEMATHS Project.

I particularly liked GridPic, free software running on Windows XP that allows students to experiment with fitting different functions over a digital image. As Jim mentioned in his presentation, you can tell that it was developed by a teacher because there is no button that finds the solution automatically. The students have to work it out for themselves.

The RITEMATHS paper presented at the 2004 MAV Conference contains references to many resources including Adrian Oldknow’s excellent collection.

In the last few years, even more visual tools have become freely available including the measurement tool in Google Earth and the Travel Planner from NRMA. Now we just need the imagination to build them into our lessons.

The item that got me thinking about Jim's workshop again was the wonderful Flickr assignment developed by Darren Kuropatwa.

The public image storage website, Flickr now allows you to annotate a photograph by adding a “note” or hot spot. When I saw the annotations about Curtain Trigonometry by one of Darren's students, I was amazed. It is the perfect example of the slogan I often use with my students - "Maths is Everywhere".

That photograph alone convinces me I have to try using images with my own classes this year.

14 January 2007

Teaching is like show business

My brother is in show business so I talked to him about my plan to become a teacher.

I knew that teaching young people involved entertaining as a part of educating so I thought he might have some tips that could help me as I embarked on a new career.

It turns out that teaching is like show business but there are differences as well as similarities.

During the times that my brother is employed on a show, he might have one or two performances each day, sometimes three. He works two or three days a week. Six days a week at most.

Altogether, an actor or entertainer like my brother might perform as many as ten times a week. Every show is the same and this can become boring after a time but you may have the opportunity to adjust the script to account for the audience reaction.

Teaching teenagers is like performing for a small but tough audience. The script has to be continuously adjusted to deal with audience reaction. You have to deal with hecklers.

In this regard, it is more like stand up comedy. The way you deal with the hecklers can make or break the performance and how the rest of the audience responds to it.

In stand up comedy, you still use the same basic script for each performance although you have to be flexible.

In teaching, you write your own one-hour script for a tough audience of thirty. At the end of the performance you immediately are faced with a new tough audience of thirty and have to present a completely new show.

This happens three, four or five times a day. New script. New audience. New hecklers.

It's a tough gig.

I asked my brother how he copes with a performance that is going off the rails – for example, if he is not feeling well or if the audience is reacting in a different way than expected.

He said that the main thing is to know where you wanted the performance to go. If you have a plan, then you are able to see how to get back on track even when you have been seriously distracted by a new thread of conversation with the audience.

That sounded familiar! A well prepared lesson plan will usually produce an effective lesson. It does not necessarily follow the script exactly but it allows you to find your way back to the punchline you want to leave them with.